The analysis of working times plays a crucial role in the logistics organization, the evaluation of operating costs and the economic return of the crops. The harvesting times are monitored by researchers, who detect the characteristics of fields and record harvesting operations times. Due to the excessive engagement in terms of economy and time, this activity cannot be carried out during all the harvesting period, but it must be planned and conducted on representative fields, usually on few hectares. The harvesting of energy crops, which are spreading rapidly in our country, has not yet been enough monitored. Therefore, there is need to evaluate the effective harvesting capacity, taking into account how the accessory times affect the performance of the machines. The evaluation can be useful for the identification of harvesters maintenance costs, since they are borrowed from other crops or are prototypes, and not deeply investigated by scientific world; furthermore the evaluation will pointed out the time needed for moving among the fields, since the crops are still scattered throughout our territory. The Panacea group has developed, in collaboration with the firm Arvatec (MI), an innovative GPS system enable to detect automatically the working times of the agricultural machines and the cartographic characteristics of the harvested plantations. This system is, now, able to detect working times on each field, but, in the future, the purpose is the processing of the total annual harvesting times for each energy crop. The innovative method consists of PC mounted on a machine, with integrated GPS for fence and times tracking software, that allows to detect and record data on field, and a second software for their visualization and processing. A machine equipped with the new GPS system permits to monitor all the work it carried out during the year, obtaining a complete and real overview of its performance according to the nature of the fields it works on; besides to a complete and detailed mapping of plants.
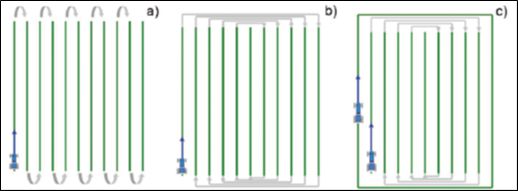
The GPS system was tested by comparing data detected manually by researchers with those detected automatically during poplar and maize harvesting by Claas Jaguar 890, which was conducted according to different working systems:
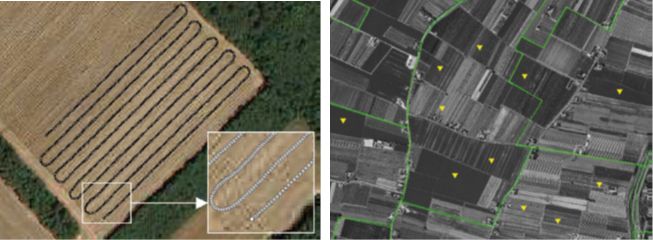
- harvesting and chopping trees plantations in parallel rows with close turns (a);
- harvesting and chopping trees plantations in parallel rows with wide turns (b);
- harvesting and chopping maize with outer perimeter opened and subsequent parallel steps in with wide turns (c).
The PC, mounted on the machine, is installed inside the cab and the GPS system is set in motion by the operator. In order to assess the accuracy of recorded data and identify anomalies in the results obtained, we proceeded to monitor the same sites according to the traditional methodology, using two operators for on-field surveys and a third one to detect the harvesting times; the last one operation was conducted according to the methodology of the Commission Internationale de L’Organisation Scientifique du Travail en Agriculture (CIOSTA). The first stage of activity has tested the device under different operating conditions as well as to identify and resolve some misclassification due to the strict interpretation of the software. Command strings, allowing to automatically correct errors in acquisition, were included in the software.
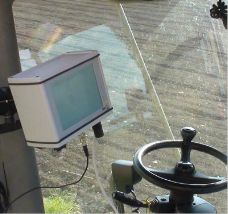 The on-field acquisition data takes place through the “ARVAnav2” system, consisting of a PC mounted on the machine, touch screen with integrated GPS for the fence and software for times detection. The PC, powered by a tractor 12 V outlet, is fixed into the cab through a special suction cup. The on-field recorded data are handled by “ARVACRA” software installed on a second computer (laptop or fixed location). This software allows to process the information and visualize them in both graphic and table.
ARVAnav2 system, developed by the firm Arvatec of Rescaldina (MI) especially for agricultural machineries, can lead them along parallel runs, drawing and recording the carried out work. This system has been upgraded, at a later stage, in order to monitor the harvesting operations of the energy crops. The GPS system records, at 1 second intervals, the machine position, detecting, for each point, the coordinates UTM – WGS84, speed and the prevailing direction. Based on the speed (m/sec) and direction (degrees to the north) data, to each point is associated a particular range, that we can distinguish among effective working time (TE), turning time (TAV) and stop time (TF).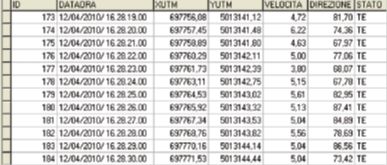
As effective time, the system classifies the points where the speed is greater than zero and the forwarddirection does not differ, beyond a certain number of degrees, from the prevailing one; otherwise, the turning times correspond to the points where the speed is greater than zero and the forward direction differs, beyond a certain number of degrees, from the prevailing one; lastly, the stop times are the points where the forward speed is equal to zero. The turning angle can be defined either before starting work (from the setting menu) or during data processing, once work is completed. 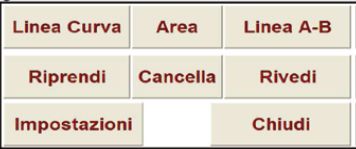 The operator is provided with a special card on which he will mark reason for the stop times (TF), making distinction between rest times, inevitable downtime, accessory times for supply and unloading and accessory times for maintenance. In the latter one, the operator has to describe the operation he performs (cleaning, replacement belt, etc.); for avoidable downtime, the operator pauses detecting. The amount of times above mentioned determines the standard working times (TS), according to the CIOSTA methodology. he first screen displayed on PC allows to manage settings, resume a work previously suspended, review passages of a performed work, calculating area of a plot and monitoring harvesting sites following two different systems:
- A-B line, when runs of the machine are parallel linear trajectories;
- curve line in the case of curved trajectories.
From the “Settings2” menu you can set the following parameters:
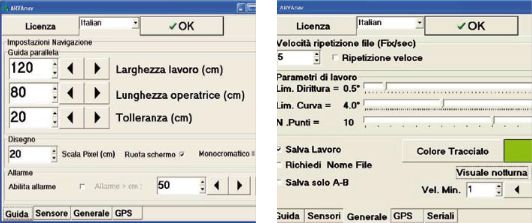
- Working width, which varies depending on the harvester used and how the head is equipped with;
- Length, to move the detection point from antenna to the harvesting head;
- Fault tolerance that is to be maintained among runs of the machine;
- Limit of straightness or tolerance (in degrees) beyond which the system considers the work according to a curve;
- Curve limit or tolerance (in degrees) beyond which the system considers the turning work. If this last parameter increases, the system recognizes delayed the turning entry, and so it is less sensitive to deviations from linear trajectory.
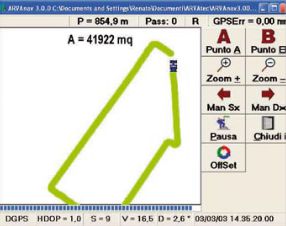 Thanks to “Area” button, displayed in the first screen, it is possible to calculate the surface of any kind of plot, from its outer perimeter. The display shows, real-time, the distance covered, perimeter in meters (P) and area in square meters (A). Between the two possible solutions for monitoring harvesting sites, the "AB Line" pattern, seems to best fit to energy crops; it defines, for each plot, the prevailing direction and sets two reference points at the beginning and end of the first row or the first run of the machine (Point A and B). Then, the system automatically draws a straight line and differentiates turnings from the effective time depending on the forward direction.
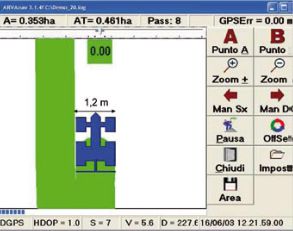 If the crop is not first harvested for parallel lines, but it should first make one or more steps along border to open the field, the A and B buttons will be activated in the first linear run of the machine subsequent to the opening of field. On the display, in addition to Point A and B buttons, there are other buttons serving to enlarge or reduce the size of the track that is being taking (Zoom ±), the Area button, which allows to save in a text file, the total area of plot, and Close and Pause buttons to interrupt or finish a work. If a work is stopped with the Pause button, it can be resumed later; a directional arrow on the PC screen will lead the operator to the point where work was suspended. But when a work is finished pressing “Close”, it can be resumed later with the “Resume”, which appears in the splash screen at startup. This option permits to select and load the reference file, going on with harvesting from where the work was finished. In the latter case it is necessary to reach the breakpoint on the basis of the path already traveled. Further information displayed at the top and bottom bar are:
- surface worked in hectares (A);
- total area of the plot in hectares (AT);
- run of the machine (Pass);
- line error compared to the previous run of the machine (GpsErr);
- reception mode of the GPS (GPS, DGPS, FLOAT, RTK);
- satellites conditions (HDOP), more the value is low, more the position is accurate;
- satellites GPS that can be seen from antenna (S);
- forward speed in km/hour (V);
- forward direction compared to the North, in degrees (D);
Works are saved on the PC memory and may be downloaded for further processing, at the end of each plot individually or all together at the end of the day or harvesting season.
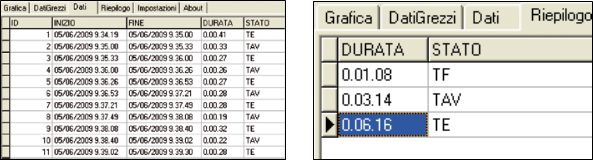
The “ARVACRA” software for visualizing and managing data on-field recorded. The data recorded on-field by the system ARVAnav2 are downloaded from a PC mounted on the machine via a USB and loaded on a second PC in which the ARVACRA 1.0 software is installed. The main screen allows to upload files recorded on field and manage the information that can be represented graphically or in table. Under “graphic”, it is possible to visualize run carried out by the machine; white points indicate areas where the machine performed the harvesting, whereas yellow points show areas where the machine performed the turning and last, the red ones, prove the areas where the car stopped. Tools available to the user can be:
- Change State, it permits to select one or more points by changing the state (TE → TAV, TAV → TF etc...). This tool is very useful to correct any abnormal data or perform simulations;
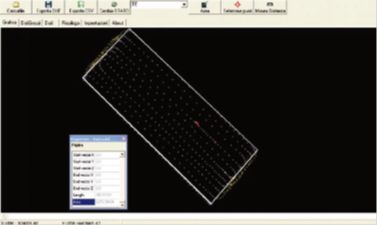
- Area; it measures the net harvested surface by clicking on four or more points on field border (Fig. 9);
- Select points; it selects individual items or a set of points that fall within a certain area;
- Measure Distance: this tool allows to measure rows length, plant width, width of the headland and rowsspacing. For a better visualization and greater precision, it can be activated, with the right button of the mouse, the zoom, magnifier and snap;
- Export DXF: the original file (extension. Log) can be exported in. Dxf or. Dwg, so that it can also be visualized and managed on GIS platform or Autocad.
Data, as previously mentioned, can be visualized also in table, highlighting, in the "Data", the history of the various phases of work, and in the “Summary”, the synthesis of times recorded during the harvesting site.
The “CSV Export” tool allows to export data in Excel format and thus to be used for subsequent operational and economic assessment. In the tab “Settings” finally, it can change the turning angle. The recorded data will be updated according to new parameters. The data acquisition system can be installed on any tractor or self-propelled agricultural machines. It is possible to work both in linear mode, harvesting for parallel lines (as for SRF crops), and in perimeter, first opening the field and then proceed to parallel rows (as for oilseeds crops). The system can automatically detect the working times and features maps of the plantations. The proposed system, now, allows to map precisely the harvested surfaces defining the number of rows, their length, the inter-rows, the net area and plot shape, but also to assess the performance of the machines during the harvesting period, comparing the obtained results with the nature of fields and defining the impact of various
factors on the performance of the machines (rows length, operating spaces, plot shape etc...). It will be, accordingly, possible to define productivity of the machines depending on characteristics of the fields and anticipate harvesting times for new power plants that canbe developed. The long term monitoring also highlights something that hardly could come out during tests performed on a few hectares areas, namely the effects of maintenance times (belt replacement, supplying and unload, flooding) on the performance of the machines. To this end, the operator, responsible for driving, will record the needed maintenance relating to a reference time. The length of the operation may be identified during data processing.

The possibility to export files recorded in. Dxf or. Dwg format, allows to manage information collected also on GIS platform, giving the possibility of more interesting and scientific applications. It is, in fact, likely to overlay data detected on-field with satellite images or orthophotos, place on the territory, single plot, create a database on plants features, develop applications that support the operator to manage harvesting operations, deliver and transport to power plants, depending on available road network and the position of the crop in the area.
The new GPS system provides acquisition of highly accurate data, reducing, significantly, both the time needed for technical survey of the machines performance during harvesting and the time required for the on-field surveys. The proposed innovation will carry out an extensive monitoring of the harvesting machines that work on whole productive areas, providing a detailed view of features plantations, their position, and performance of the machines under different operative conditions in which they will operate in the long run. This system could be used, with the help of GIS software, both in planning and yards management of energy plantations serving biomass large size power plants, and to define the total costs of harvesting site (time of transfer, maintenance, etc. .) in order to evaluate possible solutions to contract them. The research, in the coming months, will be oriented
to practical applications on-field. The experimental plan contemplates the monitoring of the following machines:
- Claas Jaguar Forage in harvesting and poplar and maize chopping with GBE-1 and RU 450 XTRA heads, respectively;
- Poplar Felling-windrowing CRA-ING/Spapperi fitted on the tractor;
- Self-Propelled Chipper Spapperi in harvesting and chopping felled and laid in rows poplar;
- Combine harvester harvesting oilseeds.