
")
")
The EU Renewable Energy Directive (RED) promotes the use of energy from renewable sources and set out binding objectives for Member States in order to achieve 20% of energy consumption from renewable sources by 2020. Predictions for the period 2007-2050 indicate that renewable energy should reach the 35% in the global supply as primary energy source (PES), and the 50% of the global electricity production.
On the basis of these premises, further efforts are needed to implement renewable resources and to overcome the current productions, which today reach only the 12% of the PES supply and the 18% of the global electricity production.
Recently, a famous Italian company operating in the agro-energy sector has started a project for building a 30 MWe power plant to be powered with the biomass coming from 7,000 ha of short rotation plantations. The plant will be realized in Emilia Romagna Region (municipality of Russi - RA), with the energetic crops to be located in a radius of 70 km from it.
According the available literature, there are two important aspects that should be considered when the energetic product is delivered to the power plant: the biomass production estimation of the catchment area [3-4] and the careful scheduling of both harvest and transport operations [5-6].
Over the period 2007-2010, within the framework of the Research Project SUSCACE (Scientific Support to Convert farmers into energy), the Engineering Unit of the Agricultural Research Council (CRA - ING) has monitored and classified the biomass plantations for the power plant, developing a GIS Application for the management of the plantation and for planning the harvesting operation. In this regard, the realization of a mapping concerning the potential energy production from biomass allowed to build a reference tool in terms of methodology as well as a powerful instrument to define the strategies to be adopted over the area of interest.
This work aimed to furnish a clear picture of the plantations characteristics, presenting the Gis Application and showing a series of simulations to define possible scenarios, in accordance with the harvesting technique adopted and the machine used.
The SW_SUSCACE_01 Software
SW_SUSCACE_01 utilizes as GIS platform the software ESRI ArcMap ® 9.2. It has been developed in Visual Basic for Applications. The software uses the information contained in a geodatabase appositely designed and implemented. For each plantation, it contains several information such as the farm owner, the crop (species, variety, year, planting layout), the geographic position, the phytopathologic status, the weed infestation, and the soil capacity and productivity. The plantation are indexed by an identifying code composed of eight numbers, which represent a sequence of sub-codes that allow to associate the plantation to the private company, the technical field, the reference farm and the owner. Such a procedure makes the computerization much easier.
 The software is easy to use and updatable. In fact, using a proper form and the corresponding combo box, it is possible to load data of new plantations or cancel them from the geodatabase. The software is able to work on different levels through a series of tools available in the toolbar work.
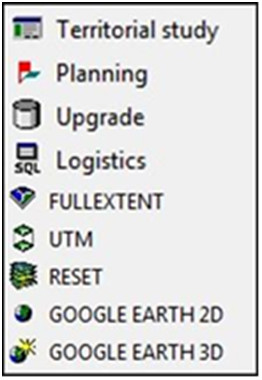
“Territorial study” and “Logistics” are processing tools that can be used by users to get information included in the Geodatabase. These include data useful for making a territorial survey or to obtain an overview of the crop-status and the technical means available. By mean of "Territorial study" tool a rapid analysis of plants conditions within a determined area is reliable. “Logistics” tool allows to manage data of individual energy crops and the information of machines available for the harvest, which are owned by contractors. The subprogram is composed of two sections, the first dedicated to plants and the second to the contractors.
The scheduling of harvest and product transportation can be simulated by the “Planning” tool. This tool identifies the plantation to be harvested, estimating also the potential biomass obtainable daily, and the number of trucks required for carrying wood chips to the power plant.
This system allows to plan and schedule the harvest operations day by day, as well as to know the days required to harvest a given area. The number of “workable” farms in a day is assessed according to plantation characteristics, road network, harvesting yard and available machines. Moreover, transportation of wood chips to power plant takes into account the expected production, the transportation capacity of trucks, the road conditions and the unloading time.
The number of daily transportations is in function of the fields’ productivity and the load capacity of the singular truck, while the number of operating trucks depends by the time taken from each vehicle to unload the chips and coming back to the field. It is therefore possible that some vehicles may repeat the same routes the same day.
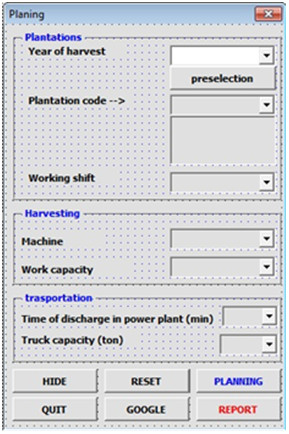 The interface of the planning tool shows parameters such as the year of harvest, the plant to be used as reference to start the harvest, the working shift (8, 10 or 12 hours), the machine type, the machine working capacity, the time taken by trucks to transport and unload wood chips, and the carrying capacity of the trailers.
These parameters can be applied to two harvesting systems:
- Cut and chip harvesting system, where sawing and chipping are performed in one operation by the forage harvester;
- Stick harvesting system, where a cut-windrower cuts and lays the plants into inter-rows during the dormant phase and a self propelled chipper with pick-up head chips the wood positioned in the interrows during the spring.
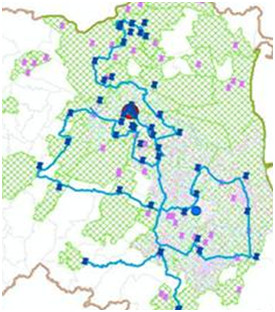
Once the input parameters are set, the program “Estimate” starts the simulation, which will show a graphic output or a report. The map shows the plantations that can be harvested during the day (starting from the chosen plant) and the corresponding road connections.
The simulation report contains two parts. The first gives details of individual fields like name, address and owner's identification code, crop, area, estimated productivity, harvest time, time for a single transport, number of tracks and courses required to deliver the product to the power plant. The second part shows information about the working day such as the total area and the number of plants that can be harvested, the expected production, the global distance between plants, the overall time needed for the harvesting operations (including the transfer time between one yard to another), and the number of trucks needed to confer the product.
The shipping time towards the conversion plant is estimated considering the distance between the edge of the plot and the biomass power plant; this considering usual roads. On the contrary, transfer times taken by machines to harvest yards are computed by taking into account non-ordinary roads, like farm roads, whose mapping requested photo-interpretation of satellite images. Data on road connections are analyzed by an algorithm, which determines for each pair of junctions the shortest path and the single type of road sections.
2.2 Plantation characteristics
In order to identify the main characteristics of the energy plantations included in the study area, different questions (queries) were addressed to the geodatabase. These were made to identify the number of energy plantations previously classified, their geographical distribution, the number of farms involved, the surface occupied, the species/variety utilized, and the power plant location.
2.3 Harvest and transport simulation
By using the “planning” tool, several simulations concerning harvest and transportation of biennial plantations were carried out. These were relative to the season 2011-2012, corresponding to the first cutting cycle. The simulations were carried out considering twenty working days, including a shift work of eight hours per day. The expected productivity was evaluated on 50 t ha-1, while the transfer time among harvesting sites was calculated considering an average velocity of machines and dumpers of 15 km h-1 in farm tracks, and 30 km h-1 in ordinary roads.
For cut and chipping operations, two methodologies already used in Italy were considered. In the first methodology, cut and chipping are grouped into a singular step (scenarios 1 and 2); in the second, these operations occur separately in two different phases (scenarios 3 and 4):
- Scenario 1: cut and chipping in one step by using Claas Jaguar forage loader equipped with a standard chipping apparatus (operative working capacity 1.20 ha h-1);
- Scenario 2: cut and chipping in one step by using Claas Jaguar forage loader equipped with a chipping apparatus designed by CRA ING (operative working capacity 1.50 ha h-1);
- Scenario 3: cut and storage into inter-rows with cut-windrower machine (operative working capacity 1.50 ha h-1);
- Scenario 4: chipping biomass windrowed by Spapperi self propelled chipper equipped with pick up head (operative working capacity 1.00 ha h-1).
The transfer time of trucks was calculated considering the speed limits established by the law. The average time taken to unload tracks at the recovery of the power plant was estimated to 30 minutes, while the loading capacity of trucks was 24 tons. The number of total vectors utilized during the transportation process was calculated considering that each vector was capable to accomplish more than one course per day.
RESULTS
3.1 Characteristics of energy plantations
Across the years 2007-2010, 121 energy plantations have been realized in 41 municipalities of 5 different provinces of Emilia Romagna Region. The farms considered were 112, for a total surface of 534.13 ha addressed to energy plantations.
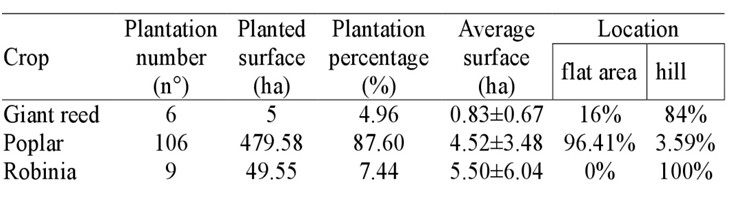 The crops used so far have been Arundo donax, Populus spp, and Robinia pseudoacacia (Table I). The 4.96% of the plantation was realized by using giant reed (0.94%
of the planted surface), the 87.60% with poplar (89.79% of the planted surface), and the 7.44% with Robinia (9.28% of the planted surface). Poplar plantations were interested for the 93,08% by the AF2 variety; the remaining 6,92 by the Monviso variety.
The giant reed plantations have an average extension of 0.83 ha (std. dev.±0.67); these are mostly referable to the demonstrative plantation of the first biennium. They were realized on hill for the 33.33%, and on flat areas for the 66.67% (respectively 16% e 84% in terms of total surface). The poplar plantations have an average extension of 4.52 ha (std. dev.±3.48); they were realized mainly on flat areas (95.28% of the plantations and 96.41% of the planted surface). Finally, those of robinia have an average extension of 5.50 ha (std. dev.±6.04); these were only located on hill.
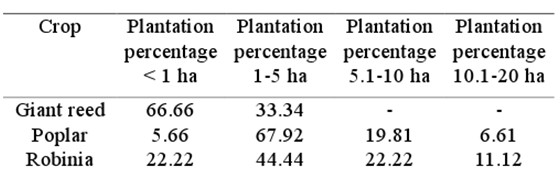 The 66.66% of the giant reed plantation has an extension lower than 1 ha, while the higher part of poplar and Robinia plantation has an extension ranging from 1 to 5 ha (respectively 67.92% and 44.44%).
3.2 Harvest and transport simulation
To verify the reliability of the software, several simulations based on real data were carried out. These were taken from the most represented plantation only (poplar plantations).
The simulation took place considering the first cutting period for the season 2011-2012. The plantations involved were 68, for a total surface of 301.46 ha and an expected production equal to 15073 tons.
The average distance among plantations involved in the harvesting, and that among plantations and ordinary roads was equal to 11.04 km e 301 m respectively.
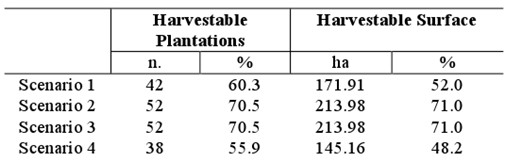 The simulations were carried out in 20 working days. Considering harvesting and chipping in a singular phase, the results shown the possibility to operate on the 60.3% (scenario 1) and on the 70.5% (scenario 2) of the harvestable plantations.
In the first case, it was possible to harvest 42 plantations, for a total surface of 171.91 ha (52% of the harvestable surface). In the second case, the plantations utilized were 52, for a total surface of 213.98 ha (71% of the harvestable surface).
 On the other hand, dividing harvesting and chipping into two separate phases, the plantations cut and windrowed were 52 (71% of the harvesting surface), of which 38 chipped (145.16 ha, equal to the 48.2% of the harvesting surface). The last data has to be put in relation to the different working capacity of the machines utilized in the two phases. Moving harvesting yards implies different paths in terms of km traveled, and different fuel consumptions.
In scenario 1, the machines have traveled overall 487 km (of which 13.3 km across farm roads). In scenario 2 and 3, they traveled 578 km (of which 14.7 across farm roads), while in scenario 4, the km traveled were 438 (of which 14.7 km across farm roads).
The simulation of the transport logistic has shown different scenarios. The transport logistic must to be intended as the delivery of the chips from plantations to the power plant.
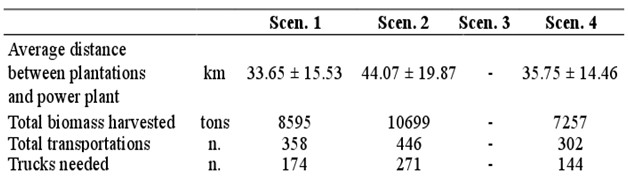 The plantations are located within 33.65 e 44.07 km from the power plant and the transportations estimated to deliver the product were 358, 446 and 302 respectively for scenario 1, 2 and 4.
Considering travel and unload times, for some trucks it was shown the possibility to make multiple daily transports. Indeed, from the elaborations obtained resulted that 174 trucks would be sufficient to make 358 transportations as those expected in scenario 1, 271 trucks for the 466 transportations of scenario 2, and 144 trucks for the 302 transportations of scenario 4.
The software allows to choose for each harvesting season different solutions that may consider the environmental and business context surrounding the power plant. Moreover, the correct scheduling allows to reduce the number of vehicles operating in the territory, having a positive impact on both economic and environmental.
CONCLUSION
The GIS allows to manage, analyze and process alphanumeric data by using spatial components, ensuring the reliability and the integrity of output data. The proposed application is an example of the potentialities offered by GIS.
The software SW_SUSCACE_01 described in this work has been designed for planning and optimizing the organizational stages of the biomass collection and transportation.
In catchment areas, where the number of energy plantations is high and the distribution is uneven, there are several variables to be kept under control (climate, soil structure and composition, cultural practices, mechanical solutions available). SW_SUSCACE_01 is a tool for analysis and decision-making support, essential for a proper and rational management of agro-energy supply chain. The organization of territorial information in a database of related layers may solve many issues connected to land management, reducing environmental impacts too.
The SW_SUSCACE_01 was planned in the perspective to become an essential tool for the fuel-management of power plants, responsible for scheduling harvesting operations, and the transfer of biomass.
It could be use also to unsure a constant supply of the material having the desired physical features (size, moisture). To this end, the software has been designed to be easily understood and upgraded.