
")
")
Poplar wood has many potential uses, and even the longest rotation cycles are relatively short compared to those of most other trees; this can favor their integration with agricultural systems. Managed on 10 to 30 years rotations, selected poplar clones can be used for different purposes. The tree portion utilized is the stem, which is separated from the crown, and prepared for production of veneer-grade logs, boards, boxwood and pulp material.
In contrast, the physical characteristics of tree branches make these woody parts unsuitable for industrial use, resulting in a low economic value. In many cases, branches and tops represent a waste, and its disposal incurs additional costs. Studies have shown that branch wood may account for up to 40 % of the total biomass available on the plantation. Disposing of such a quantity of wood could be costly and time-consuming, if profitable end-uses are not identified.
Despite the widespread presence of poplar plantation across the world, it is clear that the identification of a viable use for harvesting residues is crucial to make poplar plantations a more attractive investment.
In this regard, the increasing demand for renewable energy across Europe may offer new perspectives to this product. The Renewable Energy Directive 2009/28/EC sets new and ambitious targets for all member states, with the goal of increasing the share of renewable energy to 20% of the total by the year 2020. Within this context, the identification of new renewable energy sources is considered a priority. There is now much interest for harvesting residues (pruning, crowns, and stumps), because they are available in large quantities and their recovery can give a dramatic boost to the production of renewable energy.
However, forest operations are often seasonal, which entails the need for storage. In turn, wood storage is a complex business, whose economical efficiency is affected by many factors, and especially handling cost and product susceptibility to decay.
Wood fuels can be stored before or after comminution. Storage before comminution helps in minimizing decay by reducing the surface area exposed to potential microbial degradation. However, handling cost is higher for uncomminuted wood than it is for chips. It is therefore necessary to find ways to store comminuted wood, such as chips, without causing biomass loss or a quality decline.
Unfortunately, wood chips are extremely vulnerable to microbial degradation during storage, which often leads to high dry matter losses, reduction of energy value, risk of self-ignition, and potential human health risk due to exposure to airborne microspores.
Several investigations have been carried out to evaluate the changes in fuel quality and dry matter losses which occur during storage of comminuted wood. However, many of these studies have focused on storage of whole tree wood chips, and on species other than poplar. Moreover, there is little information available concerning the conservation capacity of comminuted poplar crown wood and its susceptibility to microbial degradation.
This study aims at determining the storage dynamics of poplar chips from two tree parts; stem and crown, with respect to internal heat development in the storage piles, changes in moisture content, dry matter losses and fuel quality. It is particularly important to know if, under the conditions typical of Southern Europe, chips obtained from poplar tree crowns are more difficult to store compared to that of poplar stems. Such information may help devising better storage techniques for chips obtained from energy plantation.
 The study compared the storage behavior of wood chips produced from two different parts of poplar trees (Populus x canadensis M.): stems with a top diameter > 20 cm, and crown wood smaller than 20 cm in diameter. The threshold of 20 cm was chosen because it corresponds to the average branching point of the studied trees.
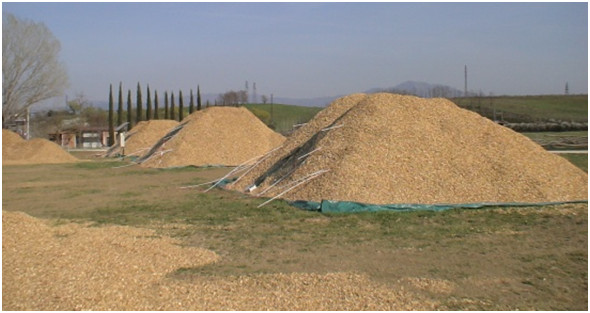
Stems and crowns, completely free of leaves, were chipped separately using the same machine, (Pezzolato), a commercial drum chipper. Details of the chipping operations have been published separately. The chips were used to build three large-scale piles for each tree part (stem and crown).
The experimentation ran between March and September 2012. Considering the importance of producing good quality fuel at a minimum cost for storage facility, 6 plastic sheets (1 per pile) were used as storage floor. Plastic sheets are less suitable than asphalt due to their low drainage properties, but they offer a much cheaper way to avoid direct microbial contamination from the soil.
All piles were 10m long, 8m wide, and 4m high, with a mean volume of 117 m3 of loose chips. During the entire storage period, all piles were exposed to the same climatic conditions.
Each pile was divided into two equal semi-piles, using a plastic net. This was done to produce two semi-piles, which could be sampled at different times. Therefore, we opened and sampled 6 semi-piles after six months, leaving the remaining semi-piles for future studies. The piles were marked with sampling points at three levels: 1.0, 2,5 and 3,5 m from the ground and identified as L1, L2 and L3 respectively.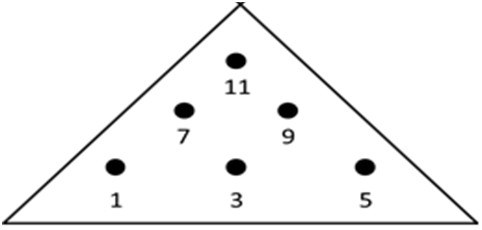
At each measurement point we placed a thermocouple (model PT 100) and 4 plastic net bags filled with fresh chips. Each bag was weighed and the chips moisture content was determined at the beginning and the end of the trial. In order to monitor heat development during storage, thermocouples were placed close to the sampling bags and the other end was connected to a computerized control unit that transmitted temperature data to the office computer in real-time. Six thermocouples were placed in each semi-pile, with a total of 36 thermocouples in all piles. Around each thermocouple, we placed 4 net bags/sampling point, for a total of 144 net bags (36 thermocouples x 4 net bags).
Fuel quality is defined here by the parameters: moisture content, ash content, heating value (lower and higher) and chemical composition. Fuel quality at the beginning of the storage period was determined using 24 chip samples (12 for each treatment) with a weight of 500 g each. Samples were randomly selected and collected from the piles during their construction. Fuel quality after storage was determined using the chips stored in the 36 net bags, collected from the different sampling points.
Dry matter losses and moisture content after storage were determined on the remaining 3 chip bags present in each point of the 6 semi-piles (i.e. 108 net bags). Initial dry weight was calculated using the moisture content of parallel samples of fresh material. At the end of the trial, sample bags were collected and weighed before and after drying in a ventilated oven set at 105 ± 2°C, until they reached constant weight. Dry matter losses were calculated using the following equation (equation 1):
DML = [1-( DW2/DW1 )] x 100
DML: Dry matter losses [%DM]
DW1: Dry weight before storage [kg]
DW2: Dry weight after storage [kg
In addition, dry matter losses were also evaluated by comparing the total dry weight of the semi-piles, measured at the beginning and at the end of the storage period. To this purpose, all the chips constituting each semi-pile were weighed by taking the incoming transports to a certified weighbridge.
At the end of the storage trial, when the semi-piles were dismantled, all the chips from each semi-pile were loaded on trucks and taken again to the same weighbridge.
The weights were corrected for moisture content to determine the dry weight of each semi-pile before and after storage. The results obtained from this operation were compared with those calculated by weighing the sample bags for validation.
Bulk density was determined before and after storage on both types of materials, according to UNI EN 15103. A steel cylinder of known internal volume was filled with chips and then weighed. Chips were dropped into the cylinder from a height of about 20 cm, to simulate the compacting effect of a conveyor. The ratio between the net weight of the cylinder and its internal volume represented chips density, expressed in kg m-3. Bulk density measurements were repeated 24 times at the start of the trial and 36 times (6 replicates for each semi-pile) at the end.
Particle size distribution was determined on 20 samples (10 per treatment) weighing 1 kg each, by using a mechanical sieve according to UNI EN 14961.
Variations in energy content were calculated with the following equation (equation 2):
∆En.%={[(1-(Dry matter losses)/100)*final LHV]-inital LHV} 100/(initial LHV)
Final LHV = Lower Heating Value after storage
Initial LHV = Lower Heating Value before storage
Data were analyzed with the Statview advanced statistics software (SAS 1999), in order to check the statistical significance of the eventual differences between treatments.
After checking the data for normality, the software was used for performing typical analyses of variance (Anova), especially suited to the experiment just described. Anova tables were drawn, in order to see how the sum of squares was divided between main effects, interactions and residuals.
Before statistical analysis, nitrogen content data were arcsine transformed in order to normalize their distribution.
During the storage period the mean daily temperature ranged between 9 and 30°C, while the accumulated precipitations amounted to 259 mm. Rainfall events were mainly concentrated in the first two months of storage, followed by a drought period of about three months.
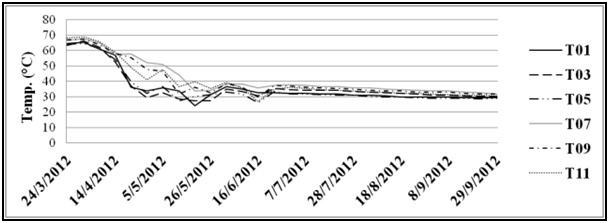
Internal heat development was monitored for the entire period of storage in the six regions of each semi-pile. The following Figures show the average internal temperature trends recorded during the storage period in the semi-piles of crown and stem chips, respectively, and it was built by averaging the temperatures recorded for that same level in the three semi-piles.
Temperature trends were very similar in the semi-piles of the same material. In contrast, temperature patterns were very much different between the two treatments.
In particular, the three semi-piles built with crown chips showed a rapid peak near 70°C in the first week of storage. Then temperature decreased over time and stabilized around the fourth month of storage. Heat development in these semi-piles did not differ much between pile layers.
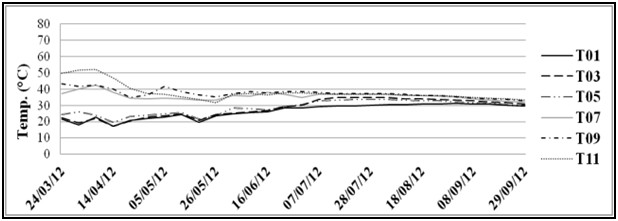
The temperature inside the stem chip piles did not rise as fast as in crown chip piles, nor did it reach similar levels. In fact, temperatures started from a level lower than the one observed for the crown chips and the maximum temperature did not exceed 55°C.
Trend of the heat developed during storage in the different measurement
points of the crown wood chip semi-piles.
Trend of the heat developed during storage in the different measurement
points of the stem wood chip semi-piles
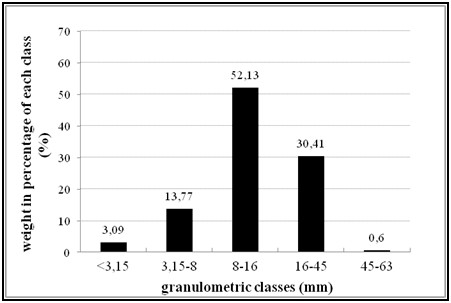
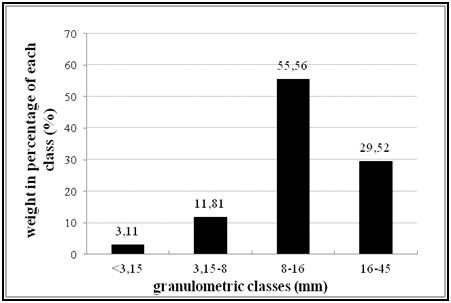
Particle size distribution did not differ significantly between chips from stem or crown biomass, which implies that pile permeability and air circulation was similar. The most represented particle length was between 8 and 16 mm. Chips within this class represented over 50% of the total weight of the semi-piles, for both material.
|
Particle size distribution of crown wood chips |
Particle size distribution of stem wood chips |
|
|
|
Concerning the moisture content (MC), all the tested samples showed a clear reduction in moisture content after six months of storage (see Table below).
Despite the higher initial MC of the crown chips, the average MC after storage was lower than that of the stem wood chips. Analysis of variance confirmed that differences between the two assortments, the two periods (beginning and end of storage) and their interaction were significant at the 1% level. No significant differences in MC were found between different layers at the end of the storage period.
|
Source |
Moisture content (%) |
|||
|
|
T0 |
T6 |
||
|
|
|
L1 |
L2 |
L3 |
|
Stem |
47.7 ± 2.7 |
35.9 ± 5.8 |
33.6 ± 4.9 |
31.6 ± 6.6 |
|
Crown |
54.2 ± 1.5 |
28,3 ± 3.5 |
30.3 ± 1.4 |
33.7 ± 2.3 |
The results of bulk density measurements showed that crown chips had a higher mean value than stem wood chips at the beginning of the trial. However, stem wood had a higher bulk density after storage. In both cases, bulk density increased after storage, by 25% for stem chips and by 18% for crown chips. Analysis of variance indicated that the differences between the two treatments were not significant, but the differences between the two periods and the interaction of period with treatment were significant at the 1% level.
Differences between bulk density values measured in different layers of the piles were not statistically significant (data are not shown).
|
Time |
Source |
|
|
|
Stem |
Crown |
|
T0 |
327.2 ± 11.7 |
341.2 ± 7.6 |
|
T6 |
408.0 ± 19.6 |
402.3 ± 20.9 |
Dry matter losses ranged between 6 and 27% (dry weight basis), depending on treatment and measurement method (net bag samples or whole pile), and they were consistently higher for stem wood chips. Both measurement methods returned similar figures and trends, validating each other. Analysis of variance indicated that the difference between treatments was significant at the 1% level.
|
Source |
Net bag |
|||
|
|
Layer |
Mean |
||
|
|
1 |
2 |
3 |
|
|
Crown |
4 |
7 |
9 |
6.6 |
|
Stem |
24 |
21 |
20 |
21.6 |
|
Source |
Semi-piles weighing |
|||
|
|
Semi-piles |
Mean |
||
|
|
A |
B |
C |
|
|
Crown |
11 |
10 |
9 |
10.0 |
|
Stem |
26 |
26 |
28 |
26.6 |
The following table shows the main quality parameters for the two chip types at the beginning of the trial. The good results obtained after storage are marked by the heating values of the two chip kinds which increased in both cases. Concerning the analysis of the chemical elements (C, H, N, S), the only significant difference between the two chip types at the beginning of the trial is in Nitrogen content, which was 0.32% in the crown wood chips and 0.21% in the stem wood chips. After six months, Nitrogen content had decreased significantly, and it was 0.21% in the crown wood chips and 0.15% in the stem wood chips. Nitrogen content differences between tree part and sampling time (initial vs. T6) were statistically significant at the 5% level, according to the Scheffe’s post-hoc test. After six months in storage, a slight increase in ash content for both chip types was also observed.
|
Parameter |
Unit |
Source |
||||
|
|
|
Crown |
|
Stem |
||
|
|
|
T0 |
T6 |
|
T0 |
T6 |
|
Ash |
% s.s. |
2.91 ± 0.7 |
3.09 ± 0.5 |
|
3.02 ± 0.3 |
3.20 ± 0.7 |
|
Nitrogen |
% |
0.32 |
0.20 |
|
0.21 |
0.15 |
|
Carbon |
% |
47.70 |
46.88 |
|
47.20 |
47.81 |
|
Hydrogen |
% |
5.90 |
6.07 |
|
5.96 |
6.16 |
|
Sulfur |
% |
0.03 |
0.03 |
|
0.03 |
0.03 |
|
HEATING VALUE |
- |
|
|
|
|
|
|
HHV |
MJ kg-1 d.w. |
16.28 ± 0.29 |
17.1± 0.25 |
|
15.61 ± 0.64 |
17.69 ± 0.34 |
|
LHV |
MJ kg-1 d.w. |
15.02 ± 0.31 |
15.87 ± 0.26 |
|
14.34 ± 0.57 |
16.35 ± 0.33 |
|
|
|
|
|
|
|
|
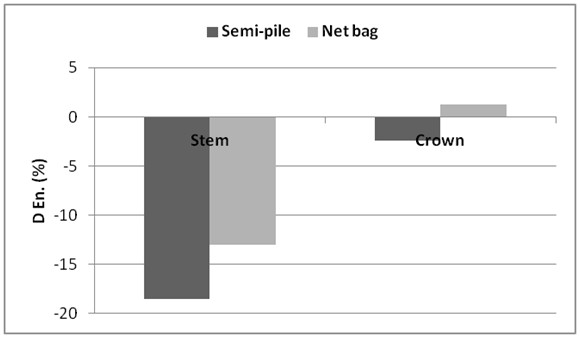
After six months of storage, changes in energy content calculated according to equation 2, using dry matter losses obtained by the two evaluation methods, were minimal in crown wood chips. Losses in the energy content of stem wood chips, however, were substantial irrespective of calculation method.
Crowns generally represent a residue to be disposed of rather than used as a commercial commodity. Easier problem-free storage may increase their attraction as a renewable fuel for the biomass energy market. The building of uncovered heap on plastic sheets is the cheapest and most suitable solution for a low-value commodity such as wood chips.
From the practical viewpoint, the results of the study indicate that it is advisable to store poplar stem wood as logs and chipping it just before use, whereas poplar crown wood can be chipped immediately and stored as chips. Due to the lower dry matter losses and the retaining of higher energy content, chips obtained from the crown can be stored for a longer period compared with stem chips without a remarkable decline of feedstock quality. This has a practical implication and particularly convenient, because it is easy to manufacture and store logs from stem wood, while it would be much more complicated to store uncomminuted crowns, which are difficult to handle and take up much space.
Stem and crown chips can possibly support the growth of different biota, adapted to the specific substrate and to the climate of central Italy, leading to a different decay rate during storage and influencing the fuel quality after the storage period.
Future studies will be needed in order to model the exact storage dynamics of different chip types, under different conditions. Ideally, such tests should be conducted under a controlled environment, in order to analyze all main factors affecting chips decay.